Setup Your Threat Hunting Lab in 30 mins…
It’s been almost a decade since I started working in the cybersecurity industry, and one question I keep getting asked is:
It’s been almost a decade since I started working in the cybersecurity industry, and one question I keep getting asked is:
“How do I practice threat hunting?
It’s a very valid question.
Unlike red teamers — who have platforms like HTB, THM, and VulnHub to sharpen their skills — blue teamers often struggle to find hands-on environments to practice effectively.
While some of these platforms do offer blue team exercises, having your own lab setup is a completely different experience. It gives you the freedom to experiment, break things, and truly understand how systems behave.
In this short blog post, I’ll walk you through a simple log monitoring setup that you can use to start your journey as a SOC analyst or threat hunter.
Components
To get started, you don’t need anything fancy.
- A Linux or Windows machine
- At least 16 GB RAM (recommended)
- At least 100 GB free space
- If using Windows → WSL support is required
In my case, I used an old laptop running Ubuntu Server, accessible over my local network and via SSH (through Tailscale).
This setup detail is optional unless you want remote access over the internet.
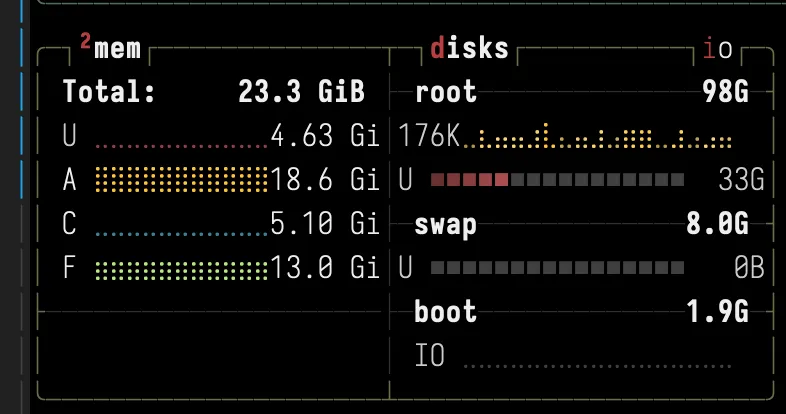 Stats of my server
Following is the architecture diagram for my setup:
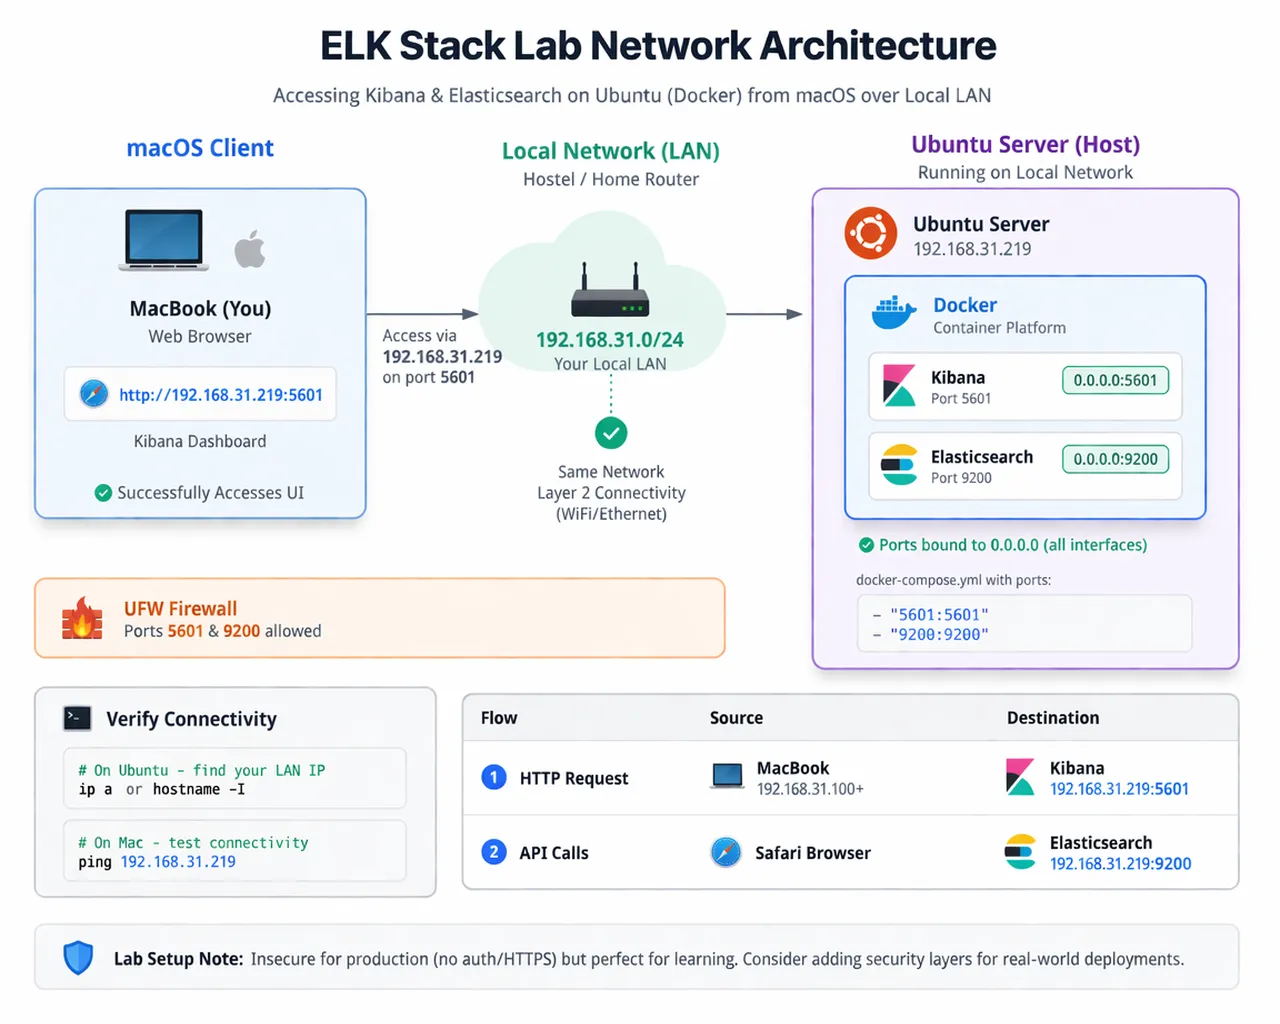 AI Generated Image of my Lab Architecture
Let’s Get Started
Installing Docker Compose
This setup uses Docker Compose to run all services, so we need it installed first.
You can follow the official documentation here, or if you’re on Ubuntu, follow along:
- Install prerequisites
sudo apt-get update
sudo apt-get install ca-certificates curl gnupg lsb-release
2. Add Docker’s official GPG key
sudo install -m 0755 -d /etc/apt/keyrings

curl -fsSL https://download.docker.com/linux/ubuntu/gpg \ | sudo gpg --dearmor -o /etc/apt/keyrings/docker.gpg

sudo chmod a+r /etc/apt/keyrings/docker.gpg
3. Add Docker repository
echo "deb [arch=$(dpkg --print-architecture) \signed-by=/etc/apt/keyrings/docker.gpg] \
https://download.docker.com/linux/ubuntu \$(lsb_release -cs) stable" \
| sudo tee /etc/apt/sources.list.d/docker.list > /dev/null
4. Install Docker Engine + Compose
sudo apt-get install docker-ce docker-ce-cli containerd.io docker-buildx-plugin docker-compose-pluginVerify installation:
docker compose versionInstalling Elasticsearch and Kibana
This part is surprisingly simple.
Just run:
curl -fsSL https://elastic.co/start-local | shThat’s it — your instances will be up and running.
After installation, you’ll receive:
- Credentials
- API key
👉 Make sure to store them securely.
Note: This script is intended for local/lab use only and is not suitable for production environments.
Accessing Your Dashboard
By default, services run inside Docker with:
- Elasticsearch → http://localhost:9200
- Kibana -> http://localhost:5601
However, to access from another device on your network, you need to expose these services.
Accessing Dashboard Over Local Network
By default, Docker binds services to 127.0.0.1 (localhost), making them inaccessible from other machines.
To expose them:
- Open your
docker-compose.ymlfile - Locate the
portssection
Change:
127.0.0.1:5601:5601to:
5601:5601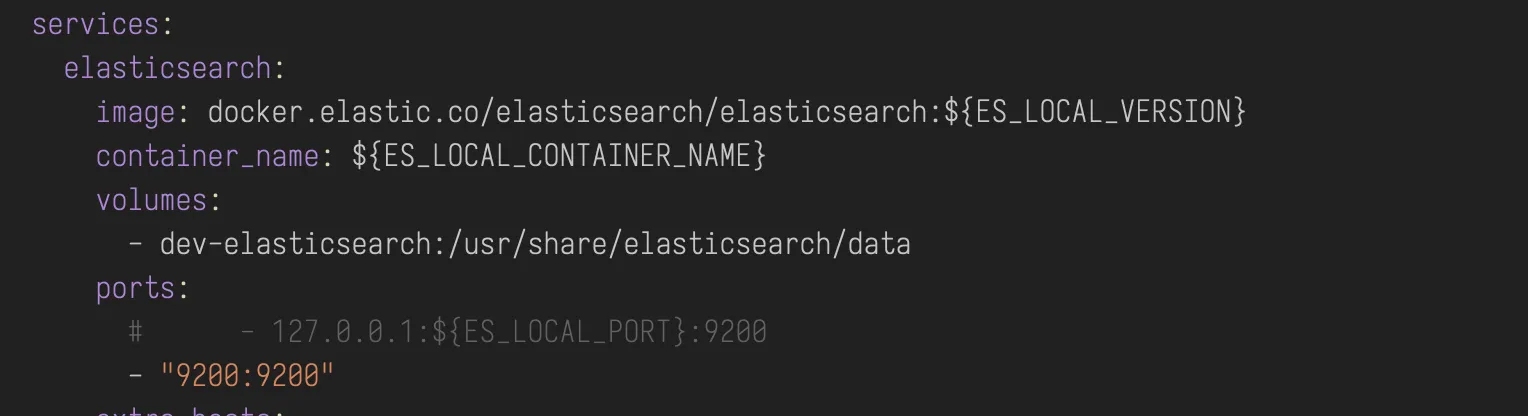 Original Line commented out and new line added in yml file
Do the same for port 9200
Restart services:
docker-compose down
docker-compose up -d
Verify:
ss -tulnp | grep 5601you should see `0.0.0.0:5601`
Now you can access Kibana from any device on your LAN: http://
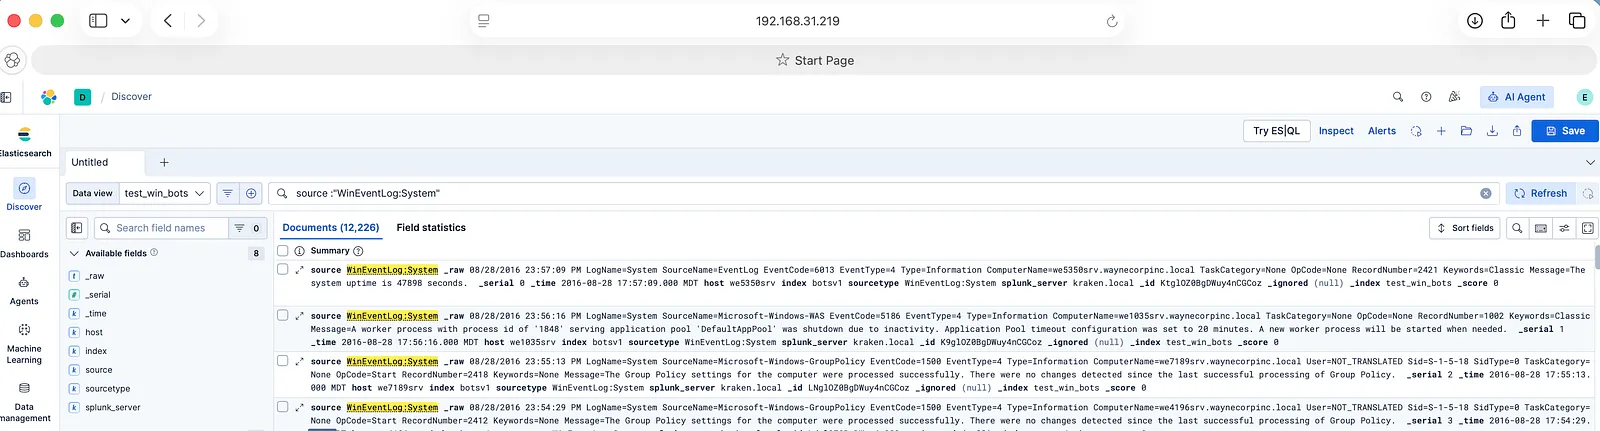 UI Accessed From Mac Host
Datasets
This is setup is not meant to ingest the data from endpoints, since the that would require more complex design . It meant to work on dead data. Here are few resources i recommend to look for data to start with
- https://github.com/0x4D31/awesome-threat-detection?tab=readme-ov-file#dataset
- https://github.com/OTRF/Security-Datasets.git
- https://www.secrepo.com/
- https://github.com/sbousseaden/EVTX-ATTACK-SAMPLES
- https://log-sharing.dreamhosters.com/
- https://github.com/splunk/attack_data
Summary
In this post, we built a simple yet practical threat hunting home lab using Elasticsearch and Kibana, powered by Docker.
We started by understanding the gap in hands-on practice for blue teamers and then moved on to setting up a minimal environment that allows you to explore and analyze logs in a controlled setup.
By exposing the services over the local network, we made the lab more flexible — allowing access from multiple devices, which is closer to how real-world environments are accessed and monitored.
Originally published on Medium.